Saturday, May 25, 2013

JavaScript Browser Diagramming Component

mxGraphs

Details:

Visualization is the process of creating a useful visual representation of a graph. The scope of visualization functionality is one of mxGraphs' main strength. mxGraph supports a wide range of features to enable the display of cells to only be limited by the skill of the developer and the platform functionality available. Vertices may be shapes, images, vector drawing, animations, virtually any graphical operations available in browsers. You can also use HTML mark-up in both vertices and edges.
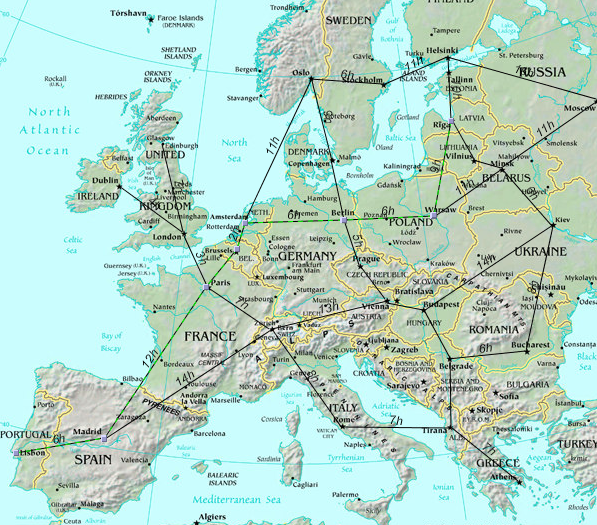


Live Samples:


Example applications for a graph visualization library include: process diagrams, workflow and BPM visualization, flowcharts, traffic or water flow, database and WWW visualization, networks and telecommunications displays, mapping applications and GIS, UML diagrams, electronic circuits, VLSI, CAD, financial and social networks, data mining, biochemistry, ecological cycles, entity and cause-effect relationships and organisational charts.


The JavaScript client of mxGraph may be licensed in two ways:
  • Under a standard commercial license, the pricing on the web site applies to these commercial licenses.
  • Under a reasonable use hosted model. This requires a key to access the hosted version, available in the examples in your evaluation download.
http://www.jgraph.com/

Tuesday, October 23, 2012

Raphaël - Vector Graphics using JavaScript

Raphaël is a small JavaScript library that should simplify your work with vector graphics on the web. If you want to create your own specific chart or image crop and rotate widget, for example, you can achieve it simply and easily with this library.

Using the library you can easily create Gauges or any other JavaScript Visualization you like.

If you are a developer you will be happy to know its under MIT license and basically Free!

Sample using Raphael:


More Info about Raphaël 

Saturday, October 20, 2012

The State of JavaScript

Brendan Eich reviews the history of JavaScript, then introduces and demonstrates some of the new features coming in ES6

Click here to watch!

Monday, August 27, 2012

Kartograph - Interactive JS map without Google Maps.

Google Maps is amazing service but lately the guys from Google decided to charge us for the free mapping stuff we were dependent on of the last few years.

Many companies stated to search for alternatives for Google and found some useful services like Open Street Map etc.

Kartograph is a new Java Script framework for building interactive map applications without Google Maps or any other mapping service. It was created with the needs of designers and data journalists in mind.

Kartograph.js is a JavaScript library for rendering SVG maps. It is built on top of jQuery and Raphaël.


More Info:
http://kartograph.org/

Friday, August 24, 2012

JustGage - Gauge Library in JavaScript

The JS world is booming with new stuff and almost every day I can see more and more visualization libraries, one of them is JustGage which allows you to create half circular gauges in no time.

JustGage  is a simple yet beautiful Gauge visualization that allows you create elements using jacascript and Raphael.js


It is based on Raphaël library for vector drawing, so it’s completely resolution independent and self-adjusting.

Using the library is simple, just load the libraries: 


  • <script src="raphael.2.1.0.min.js"></script>
  • <script src="justgage1.0.min.js"></script>

Create your Gauge div:

<div id="gauge" class="200x160px"></div>

Run some simple JS code to apply on the Div:


  • var g = new JustGage({
  • id: "gauge",
  • value: 67,
  • min: 0,
  • max: 100,
  • title: "Visitors"
  • });


I hope they will extent there library with some more cool Gauges soon!

More info & Download:
http://www.justgage.com/ 

Sunday, May 20, 2012

Libaries for JavaScript Visualization Development


Another good list of JavaScript Visualization components:

Source:

Tuesday, May 15, 2012

10 Awesome Data Visualization Tools for the Web

Just wanted to point you to a cool post about JavaScript visualizations, some of the items are already covered in my older posts.


Check it out here

Have a Visual day!