mxGraphs
Details:
Visualization is the process of creating a useful visual representation of a graph. The scope of visualization functionality is one of mxGraphs' main strength. mxGraph supports a wide range of features to enable the display of cells to only be limited by the skill of the developer and the platform functionality available. Vertices may be shapes, images, vector drawing, animations, virtually any graphical operations available in browsers. You can also use HTML mark-up in both vertices and edges.Live Samples:
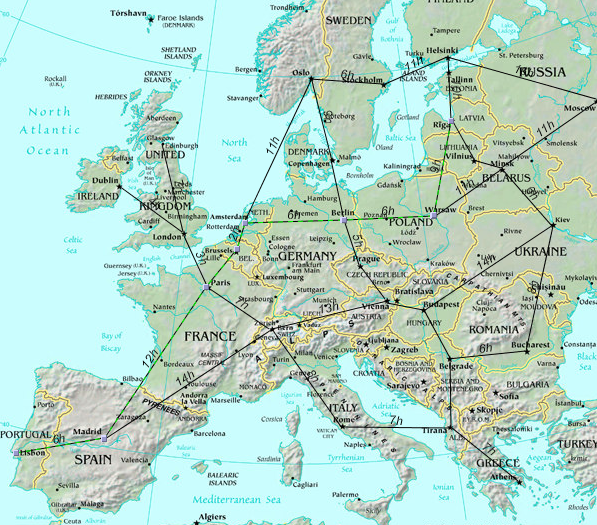
Example applications for a graph visualization library include: process diagrams, workflow and BPM visualization, flowcharts, traffic or water flow, database and WWW visualization, networks and telecommunications displays, mapping applications and GIS, UML diagrams, electronic circuits, VLSI, CAD, financial and social networks, data mining, biochemistry, ecological cycles, entity and cause-effect relationships and organisational charts.
The JavaScript client of mxGraph may be licensed in two ways:
- Under a standard commercial license, the pricing on the web site applies to these commercial licenses.
- Under a reasonable use hosted model. This requires a key to access the hosted version, available in the examples in your evaluation download.

No comments:
Post a Comment